Analytics
Analytics on your flow is presented on the Information page (general information) and in the editor (node specific information)
General analytics
On the Information page of your flow, you are presented with general analytics regarding your flow.
For the selected time period you can see:
- Total amount of times your flow has been executed
- How many times your flow:
- Has been completed successfully
- Encounter a user hangup
- Failed
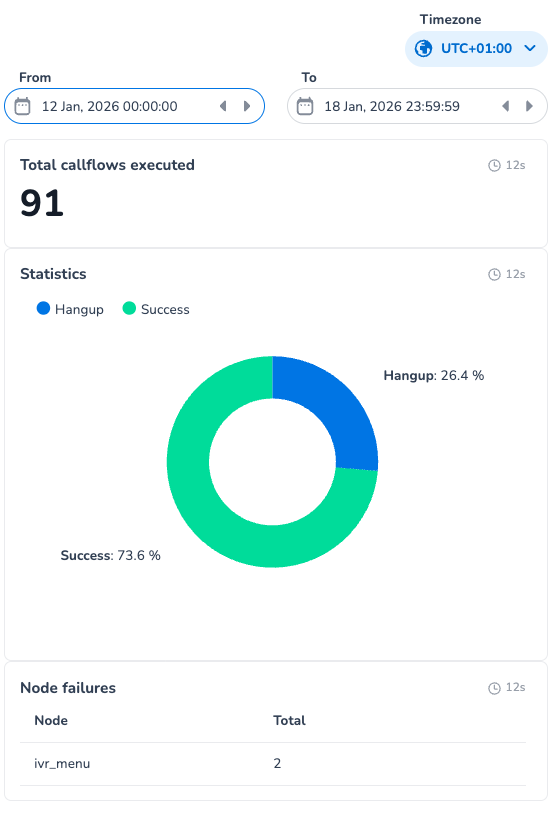
- Which nodes in your flow encountered an error and how many
- Failing nodes do not necessarily mean a failing flow. Clicking on a node-failure entry in the table will redirect you to the editor and open the information on the node in question.
- 'View details' will show you all errors and its details (for the selected time period)
- Which nodes in your flow encountered hangups and how many
- hangups can be initiated by the caller or by the flow.
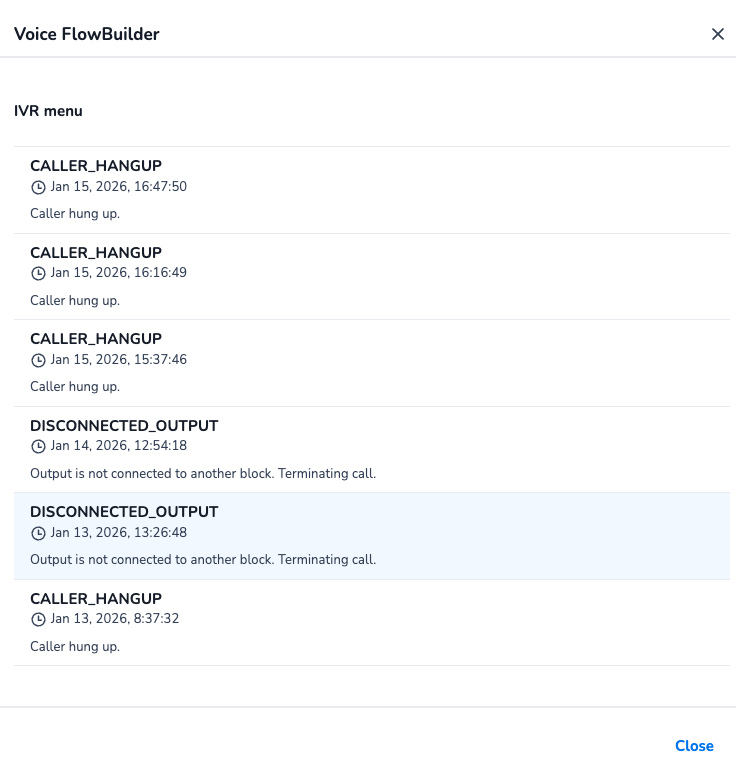
- 'View details' will show you all hangups and its details (for the selected time period)
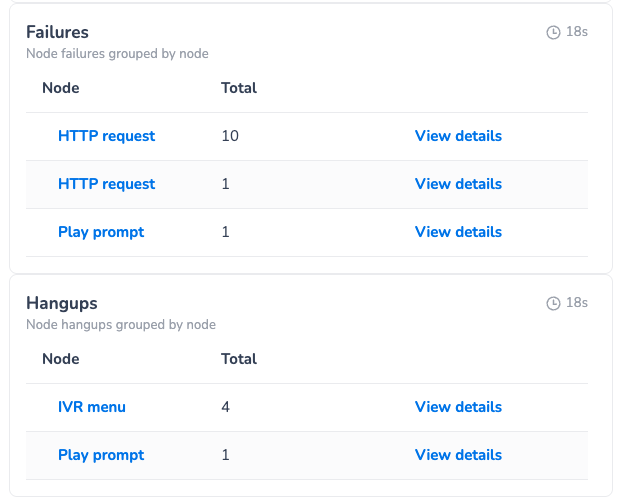
Hangup Details:
Node specific analytics
The editor shows node specific data for the selected time period. Each node shows:
- Total hits for that node
- Total failures on that node
- Total user hang ups on that node
Example
The call was answered 12 times. Each of those calls entered the 'Play prompt' node. Twice did a user hang up while the prompt was being played. 10 calls were transferred.

Example2
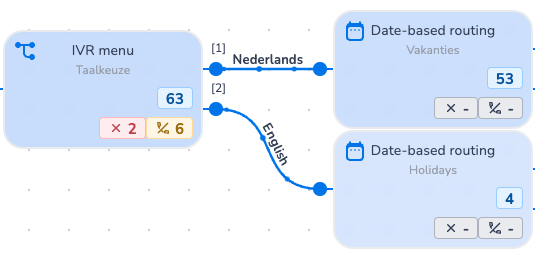
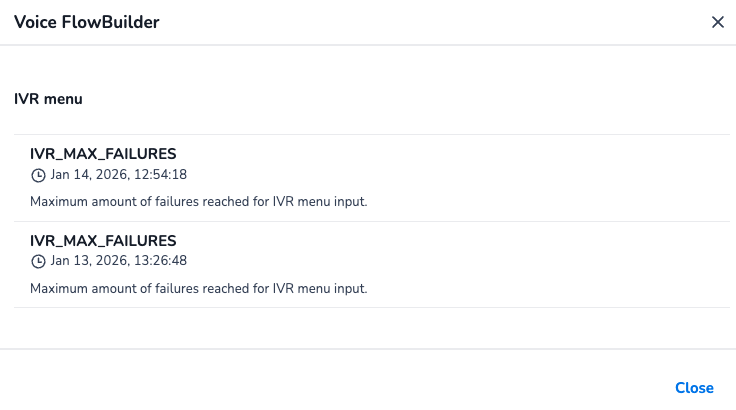
The IVR menu was successfully completed 63 times. 53 times the caller chose 'Nederlands', 4 times they chose 'English'. 6 times a hangup was registered. Twice an error occurred within the IVR menu before a valid chose was made. (Details of this error can be consulted in the information page and shown below.)