Forecast
The Forecast page helps you plan your staffing. For each department and channel, it shows how many conversations to expect over the next 7 days, hour by hour, and how many agents you need to handle them.
Forecast carries a Beta tag next to its title. Hover over the tag to read the app's own reminder: this feature is in beta, and forecasted volumes should be used as a guide, not a guarantee.
What you see
The page has three parts:
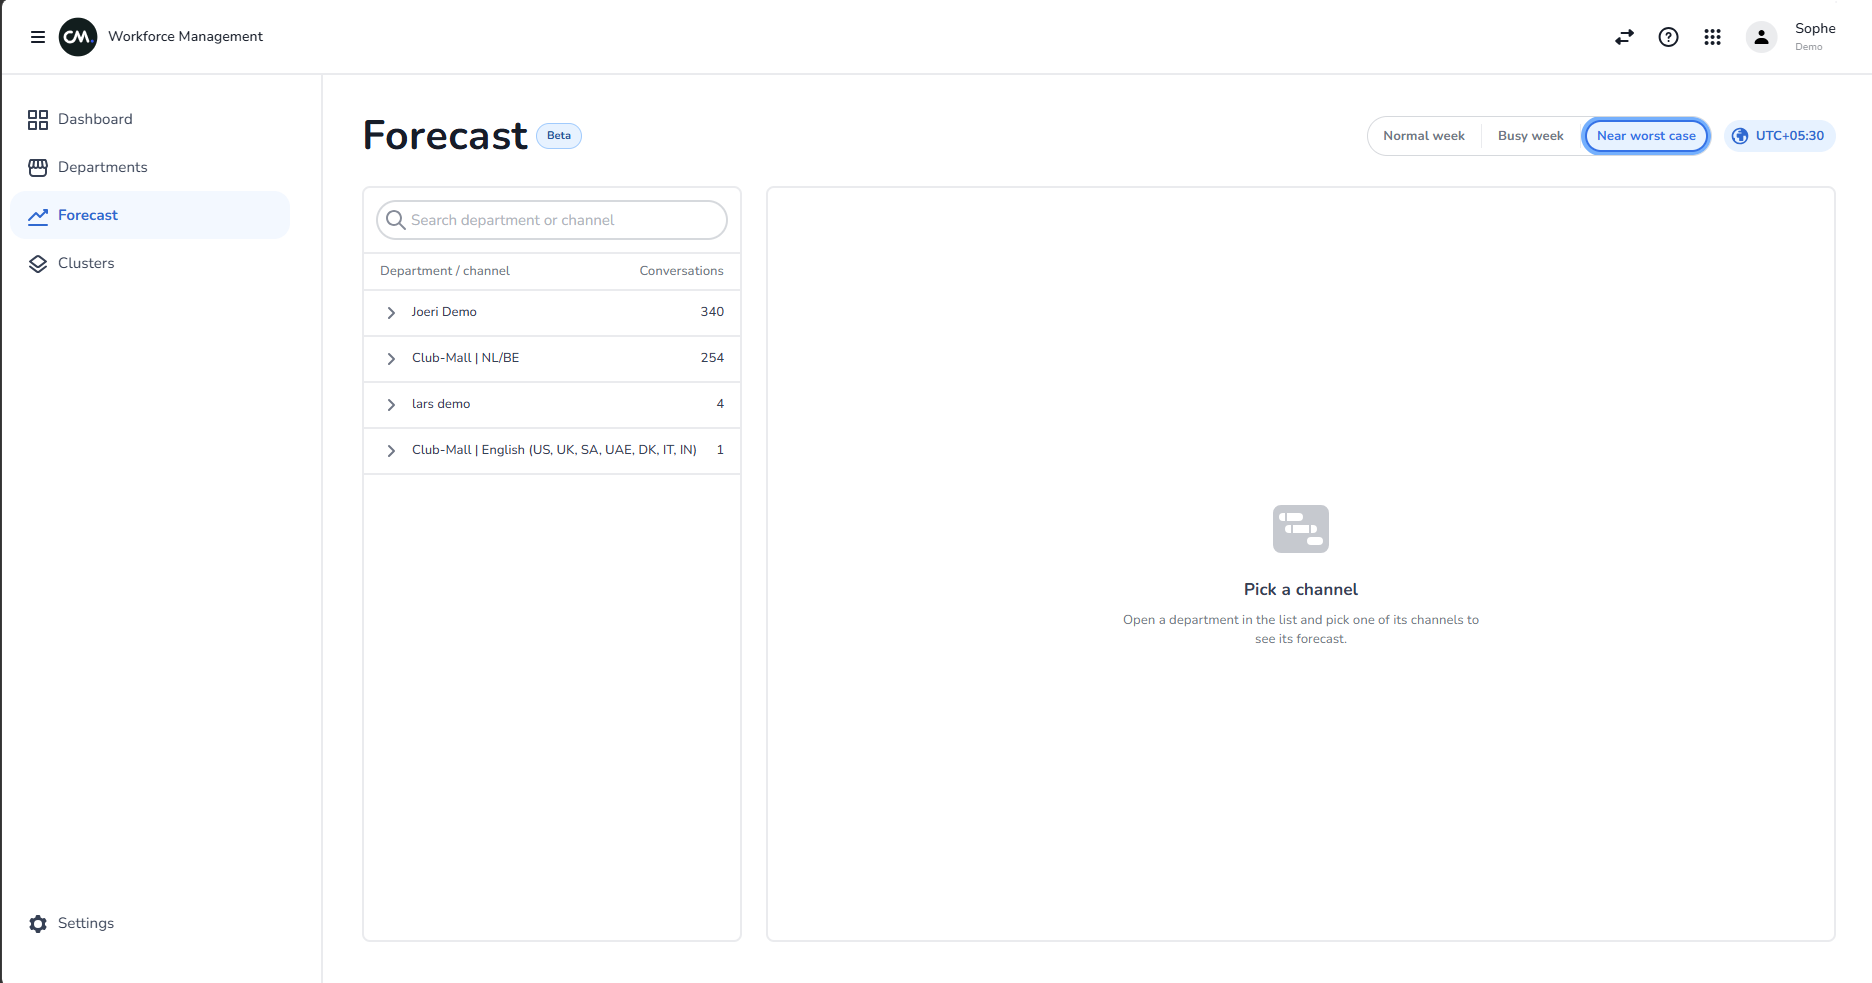
- The header — The page title with the Beta tag, a switch for the type of week, and a time zone picker
- The list on the left — Every department, with the channels inside it and the expected number of conversations
- The forecast on the right — The forecast for the channel you pick
Until you pick a channel, the right side shows Pick a channel and asks you to open a department in the list and pick one of its channels.
Choose the type of week
Forecasts can differ, so the app shows three possible weeks. Use the switch in the header to choose one:
| Option | What it shows |
|---|---|
| Normal week | The volume you can expect in a normal week |
| Busy week | The volume you can expect in a busy week |
| Near worst case | The volume you can expect in a very busy week, close to the worst case |
The option you choose changes every number on the page: the list, the day tiles, the staffing figures and the line on the chart.
Choose the time zone
The time zone picker in the header decides where each day starts and ends, and which hours are shown. It starts on the time zone of your browser.
Change it when you plan for a team in another time zone. For example, choose the time zone of the team to see their days and hours.
Pick a department and channel
- In the list on the left, find the department you want. The list shows each department with the number of conversations expected for the next 7 days.
- Select the department to open it. The channels of that department appear underneath, each with a channel type: Instant, Non-instant or Unknown type.
- Select a channel to see its forecast on the right.
You can use the search box (Search department or channel) to narrow the list:
- Type a department name to show that department with all its channels.
- Type a channel name to show only the channels with that name, in every department that has one.
- While you search, all matching departments open by themselves.
Departments and channels are listed with the busiest first. Channels with no conversations expected under the chosen week type are left out, and so are departments that have no channels left. If nothing is left, the list shows No forecast data to display.
[IMAGE NEEDED: #7 — The department list with one department open, showing its channels with their channel types, the search box above the list, and one channel selected.]
Read the forecast
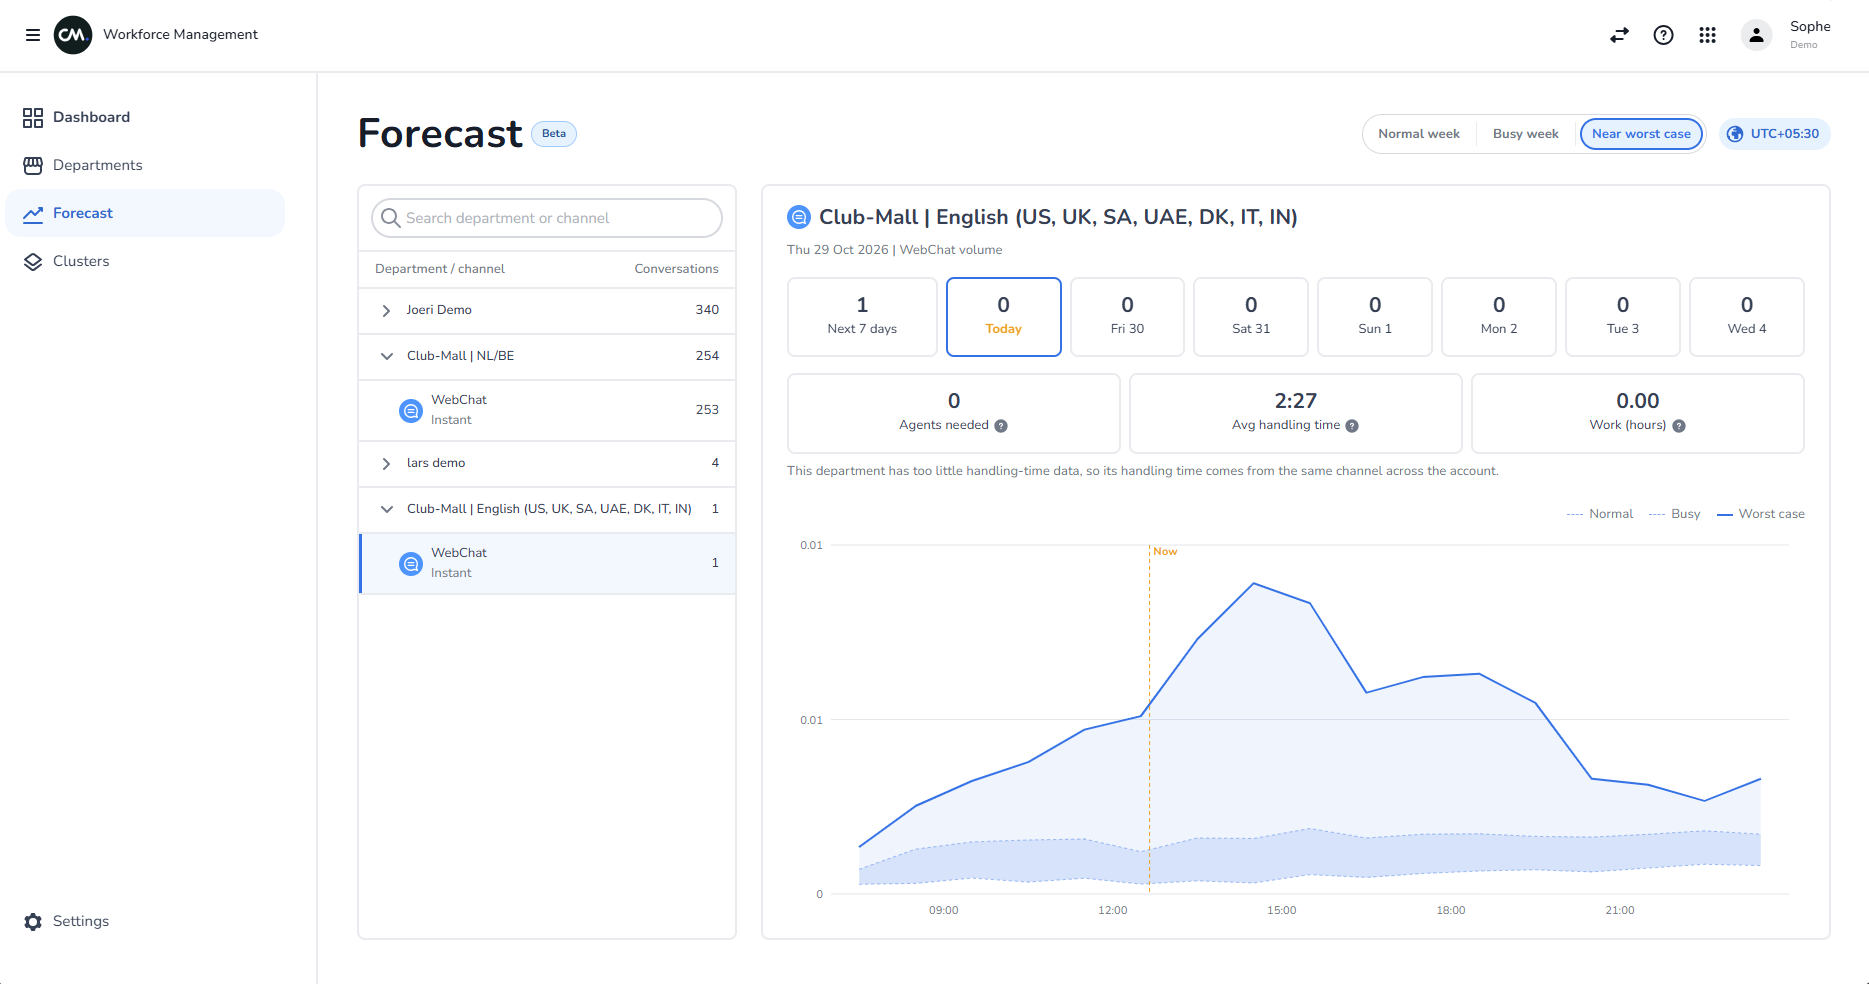
When you select a channel, the right side shows its forecast. The heading shows the department and the channel icon. Below it, you see the period and the channel, for example "Wed 23 – Tue 29 Sep | WhatsApp volume". When you select a single day, the period shows that one date.
Day tiles
A row of tiles shows the expected number of conversations for each period:
- Next 7 days — The whole week
- Today — Today's tile has the label Today
- One tile per other day, for example "Thu 24"
Select a tile to look at that day only. The staffing figures and the chart then switch to that day. After you pick a channel, the page starts on today's tile. Select Next 7 days to go back to the whole week.
If the row is too wide for your screen, scroll sideways to see the other tiles.
Staffing figures
Below the tiles, three figures help you plan. They cover the whole week or the day you selected. Hover over the help icon next to a figure for the app's explanation.
| Figure | What it means |
|---|---|
| Agents needed | The number of agents to put on the roster in the busiest hour of the period. The calculation allows for shrinkage, which covers breaks, meetings and leave. Quieter hours need fewer agents. |
| Avg handling time | The average time an agent spends on one conversation, in minutes and seconds |
| Work (hours) | The total agent time to plan for in this period, in hours. For non-instant channels, the time counts in the open hours when conversations are answered, not when they arrive. |
A dash (—) means the app could not calculate the figure. Under the figures, the app can show a short note:
- When a department has too little handling-time data, the handling time comes from the same channel across the whole account.
- When there is not enough handling-time data anywhere for the channel, the app cannot calculate staffing.
- If the staffing could not be loaded, the app says so. Try again in a moment.
Chart
The chart shows the expected conversations per hour.
- The line follows the week type you chose.
- The shading shows the range between the three week types. The darker area lies between Normal and Busy. The lighter area lies between Busy and Worst case.
- The thin dashed lines follow the other two week types.
- The legend above the chart names the three lines.
- The Now marker shows the current moment, when it falls inside the period shown.
In the week view, the days are listed along the bottom. Select a day on the chart to open it. In the day view, the hours are listed along the bottom.
Hover over the chart to see a box for a single hour. It shows the day and the hour, the expected conversations per hour for Normal week, Busy week and Near worst case, and Agents to roster for that hour once the staffing figures are in.
[IMAGE NEEDED: #8 — The chart in the week view with the legend, the shaded range, the Now marker and the hover box open on one hour, showing the three week types and Agents to roster.]
If the forecast does not load
If the forecast cannot be loaded, a red message appears at the top: Could not load the forecast. Please try again. Refresh the page or open it again after a moment.
Tips
- Start with Normal week, then switch to Busy week and Near worst case to see how much extra capacity you may need.
- Select the busiest day tile and read Agents needed to decide how large that day's roster should be.
- The Forecast page does not update by itself. Open the page again to load the latest forecast.