Departments
The Departments page lets you compare all your departments side by side. Use it to spot which departments are busy, which are falling behind, and how departments in the same cluster perform together.
Unlike the Dashboard, this page always shows every department. There is no department filter. You can only change the time range.
What you see
Below the page title, you find the time range filter and up to four cards:
- Voice
- Webchat
The WhatsApp, Webchat and Email cards only appear when your account has at least one department. Each card starts closed. Select its title to open it, and select it again to close it.
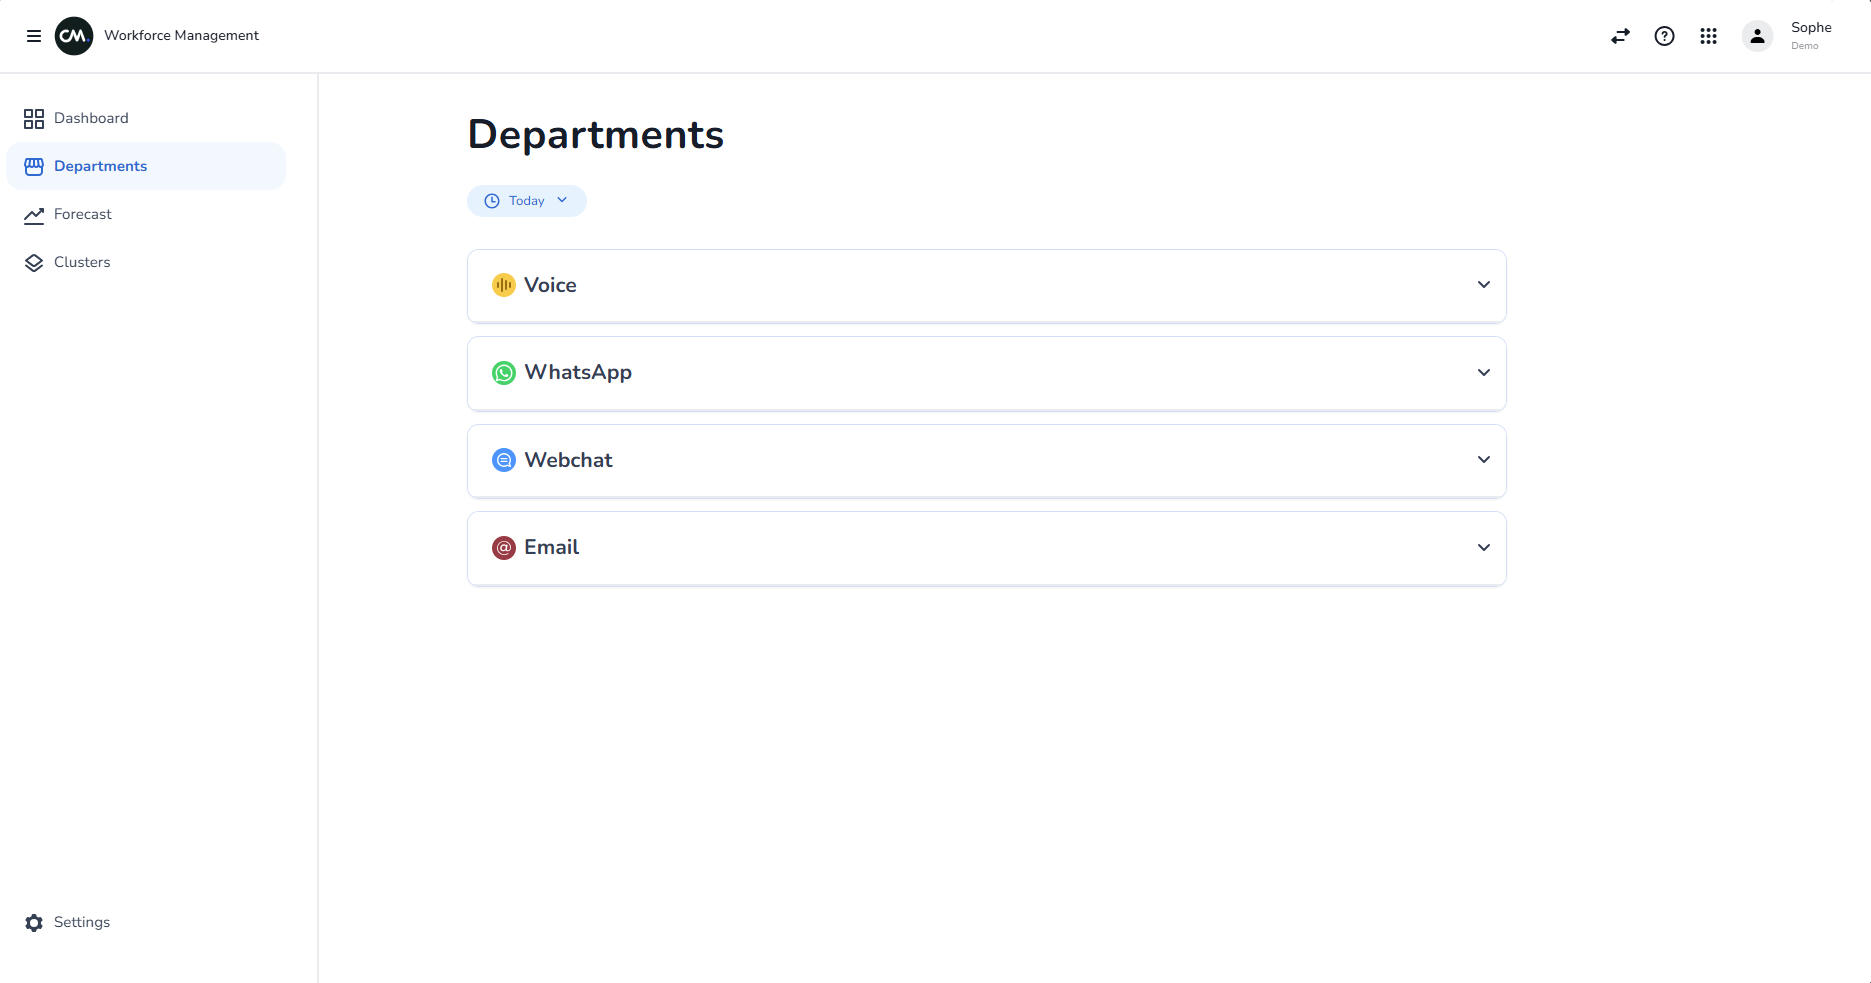
Choose the time range
The time range works exactly as on the Dashboard. It starts at Today, and you can switch to Last 1 hour, Last 3 hours, Last 6 hours, Last 12 hours, or pick your own start under From. See Choose the time range.
The time range changes the figures that cover a period of time, such as Inbound, Processed and Missed calls. Figures that show what is happening right now, such as Queue, are not affected.
The numbers on this page do not update by themselves. To see the latest figures, change the time range or open the page again.
Voice card
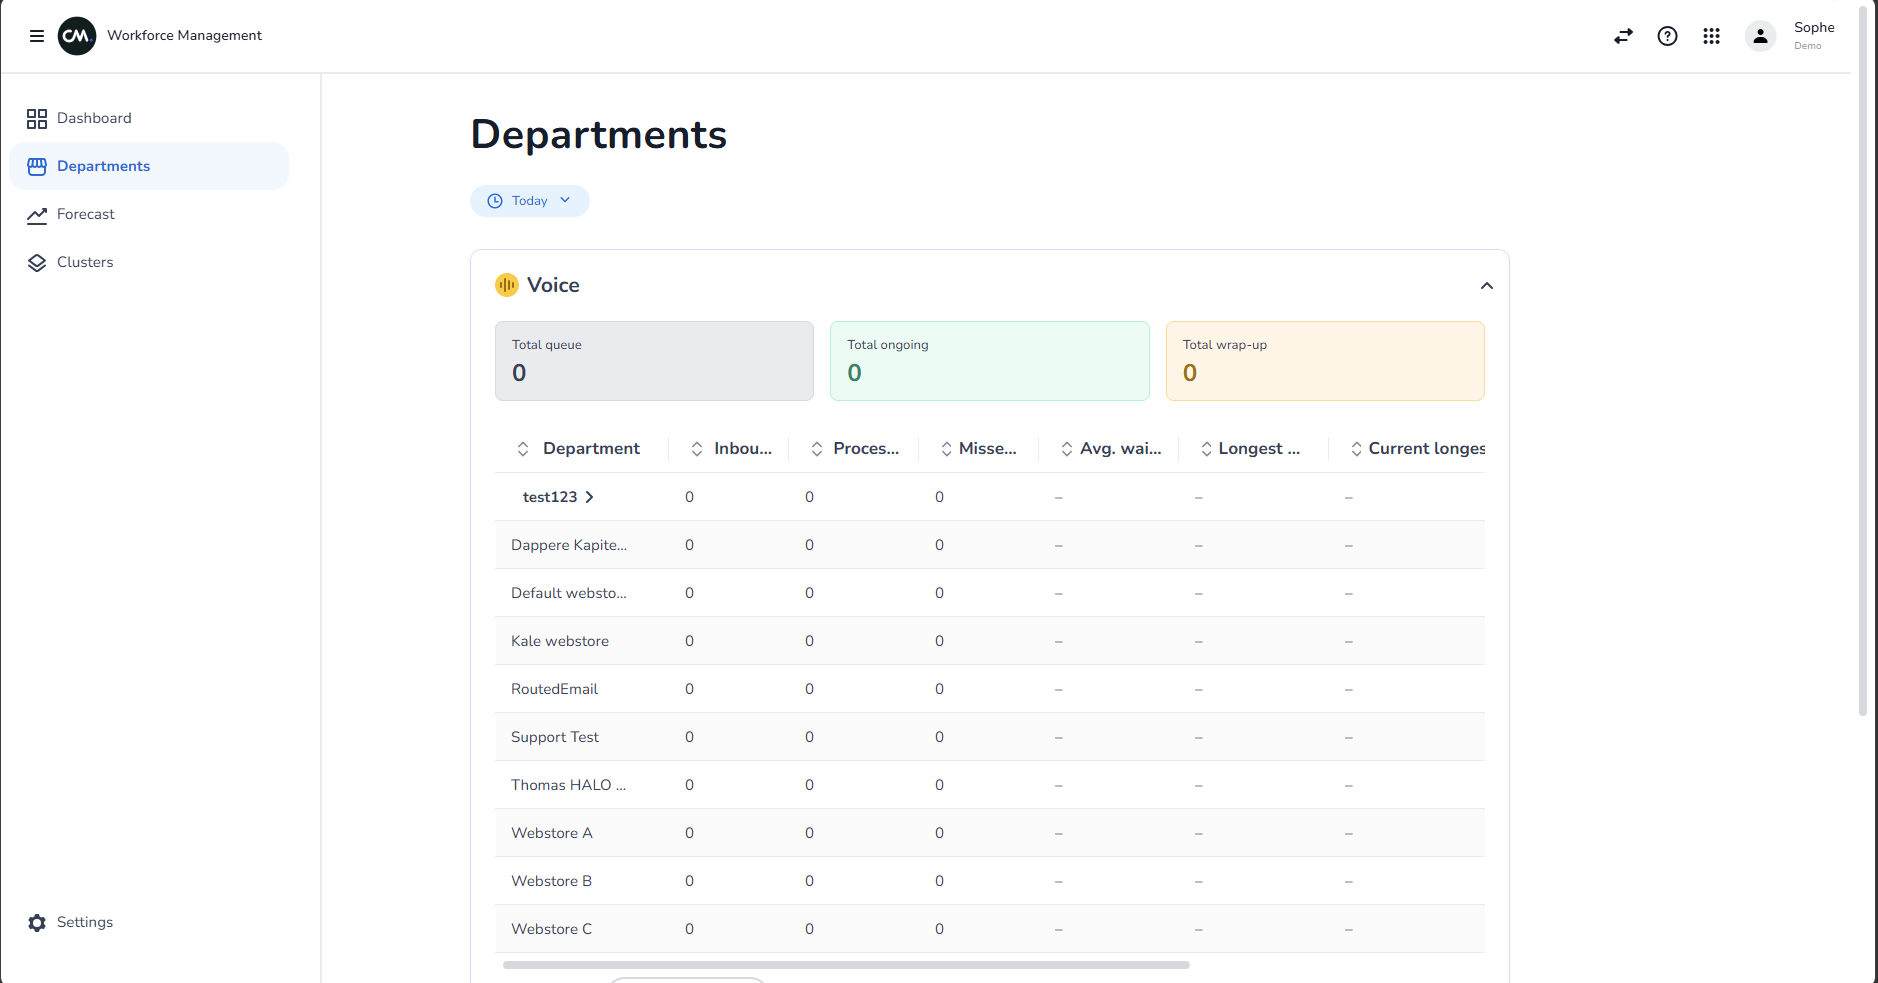
Open the Voice card to see three totals and a table.
Totals
The three boxes at the top add up all departments:
| Label | What it means |
|---|---|
| Total queue | Calls waiting across all departments |
| Total ongoing | Calls in progress across all departments |
| Total wrap-up | Calls in wrap-up across all departments |
Table
The table has one row for each department with these columns:
| Column | What it means |
|---|---|
| Department | The name of the department or cluster |
| Inbound | Calls that came in during the time range |
| Processed | Calls that were completed during the time range |
| Missed calls | Calls that were not answered |
| Avg. wait time | The average time callers waited |
| Longest wait time | The longest time a caller waited |
| Current longest wait time | How long the call that has waited longest in the queue has been waiting right now |
| Avg. call time | The average length of a call |
| SLA% | The percentage of calls that met the service level target, out of all calls that were measured |
| Queue | Calls waiting right now |
A dash (–) means there is no figure to show, for example when a department had no calls in the time range. Times are shown as minutes and seconds (for example 02:35), and as hours, minutes and seconds when they are longer than an hour.
WhatsApp, Webchat and Email cards
These three cards work the same way. The Email card combines all email channels.
Totals
| Label | What it means |
|---|---|
| Total backlog | Open conversations across all departments |
| Total on time | Conversations that are on time across all departments |
| Total expired | Conversations that have expired across all departments |
Table
| Column | What it means |
|---|---|
| Department | The name of the department or cluster |
| Inbound | Conversations that came in during the time range |
| Processed | Conversations that were completed during the time range |
| Backlog | Open conversations |
| Snoozed | Snoozed conversations |
| On time | Conversations that are on time |
| Expiring | Conversations that are about to expire |
| Expired | Conversations that have expired |
| SLA% | The percentage of conversations that met the service level target, out of all conversations that were measured |
A dash (–) means there is no figure for that department and channel.
[IMAGE NEEDED: #5 — The WhatsApp card open, showing the three totals (Total backlog, Total on time, Total expired) and the table with all its columns.]
The app does not show how On time, Expiring, Expired and the SLA% target are defined. If you need to know exactly when a conversation counts as expiring or expired, ask your administrator or CM.com support.
Clusters in the tables
If you have created clusters, the tables list them first, in bold. A cluster row shows the combined figures of its departments.
- Select a cluster row to show the departments inside it.
- Select it again to hide them.
Departments that are not part of any cluster follow after the clusters as normal rows.
A cluster row combines its departments like this:
- Counts such as Inbound, Processed and Queue are added up.
- Wait times and call times in the Voice table are averages of the departments. The longest wait is the highest value of the departments.
- SLA% is calculated from all conversations in the cluster for the channel cards. In the Voice table it is the average of the departments.
[IMAGE NEEDED: #6 — A Departments table with one cluster row expanded to show its departments underneath, and a few departments without a cluster listed below it.]
Sort and page through the table
- Select the arrow button next to a column name, or the column name itself, to sort by that column. The first selection sorts from highest to lowest. The second sorts from lowest to highest. The third clears the sorting.
- Only one column is sorted at a time. Departments stay inside their cluster when you sort, and the clusters are sorted by their combined figures.
- Dashes always end up at the bottom.
- Use the page controls under the table to move between pages and to change how many rows you see per page. The default is 10. Clusters and departments without a cluster count as one row each. The departments inside a cluster do not count separately.
Tips
- Compare departments in the same cluster by opening the cluster row.
- Sort the Voice table by Current longest wait time to find the queue that needs help first.