Dashboard
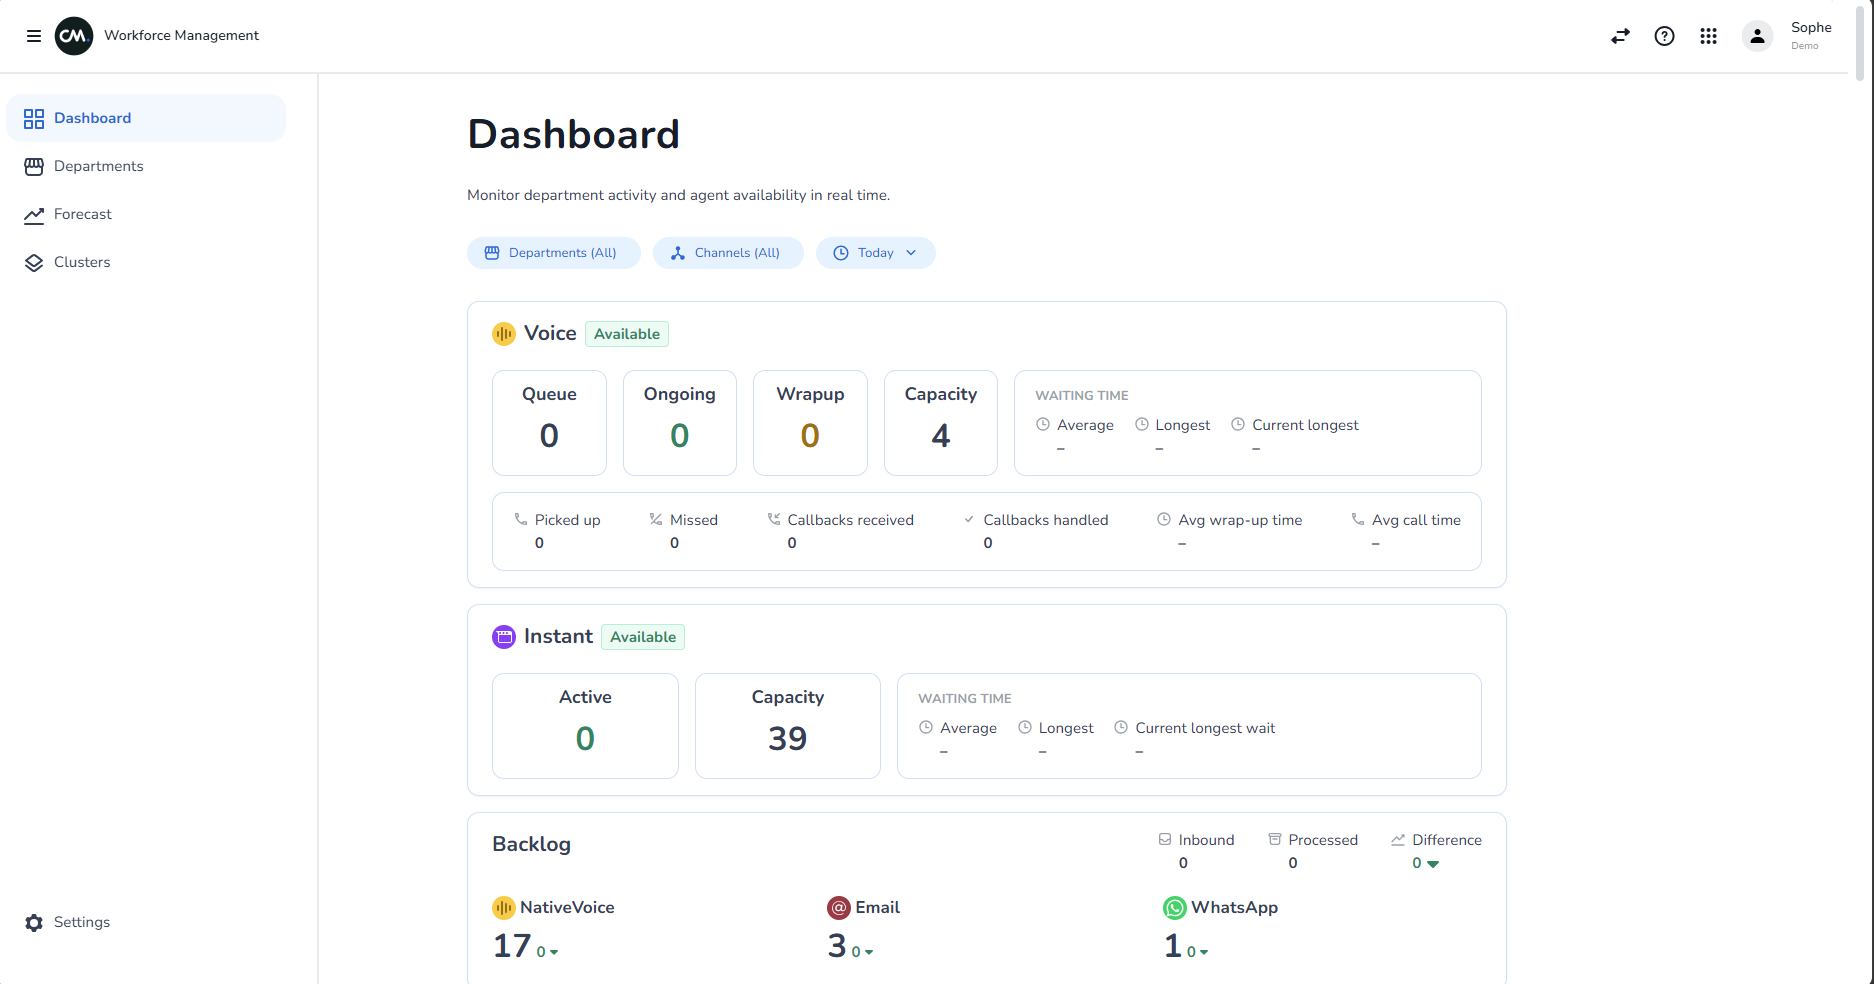
The Dashboard shows you what is happening in your departments right now: calls waiting, conversations in progress, how long customers wait, and which agents are available.
Numbers on this page update by themselves while you keep it open.
What you see
At the top of the page you will find a filter bar. Below it, the page shows:
- An overview — One set of cards that adds up all the departments you selected
- One section per department — The same cards for each selected department, headed by the department name
Each set of cards contains Voice, Instant, Backlog and Agents.
Choose what to show
The filter bar has three filters. Your choices for departments, clusters and channels are remembered the next time you open the app.
Departments and clusters
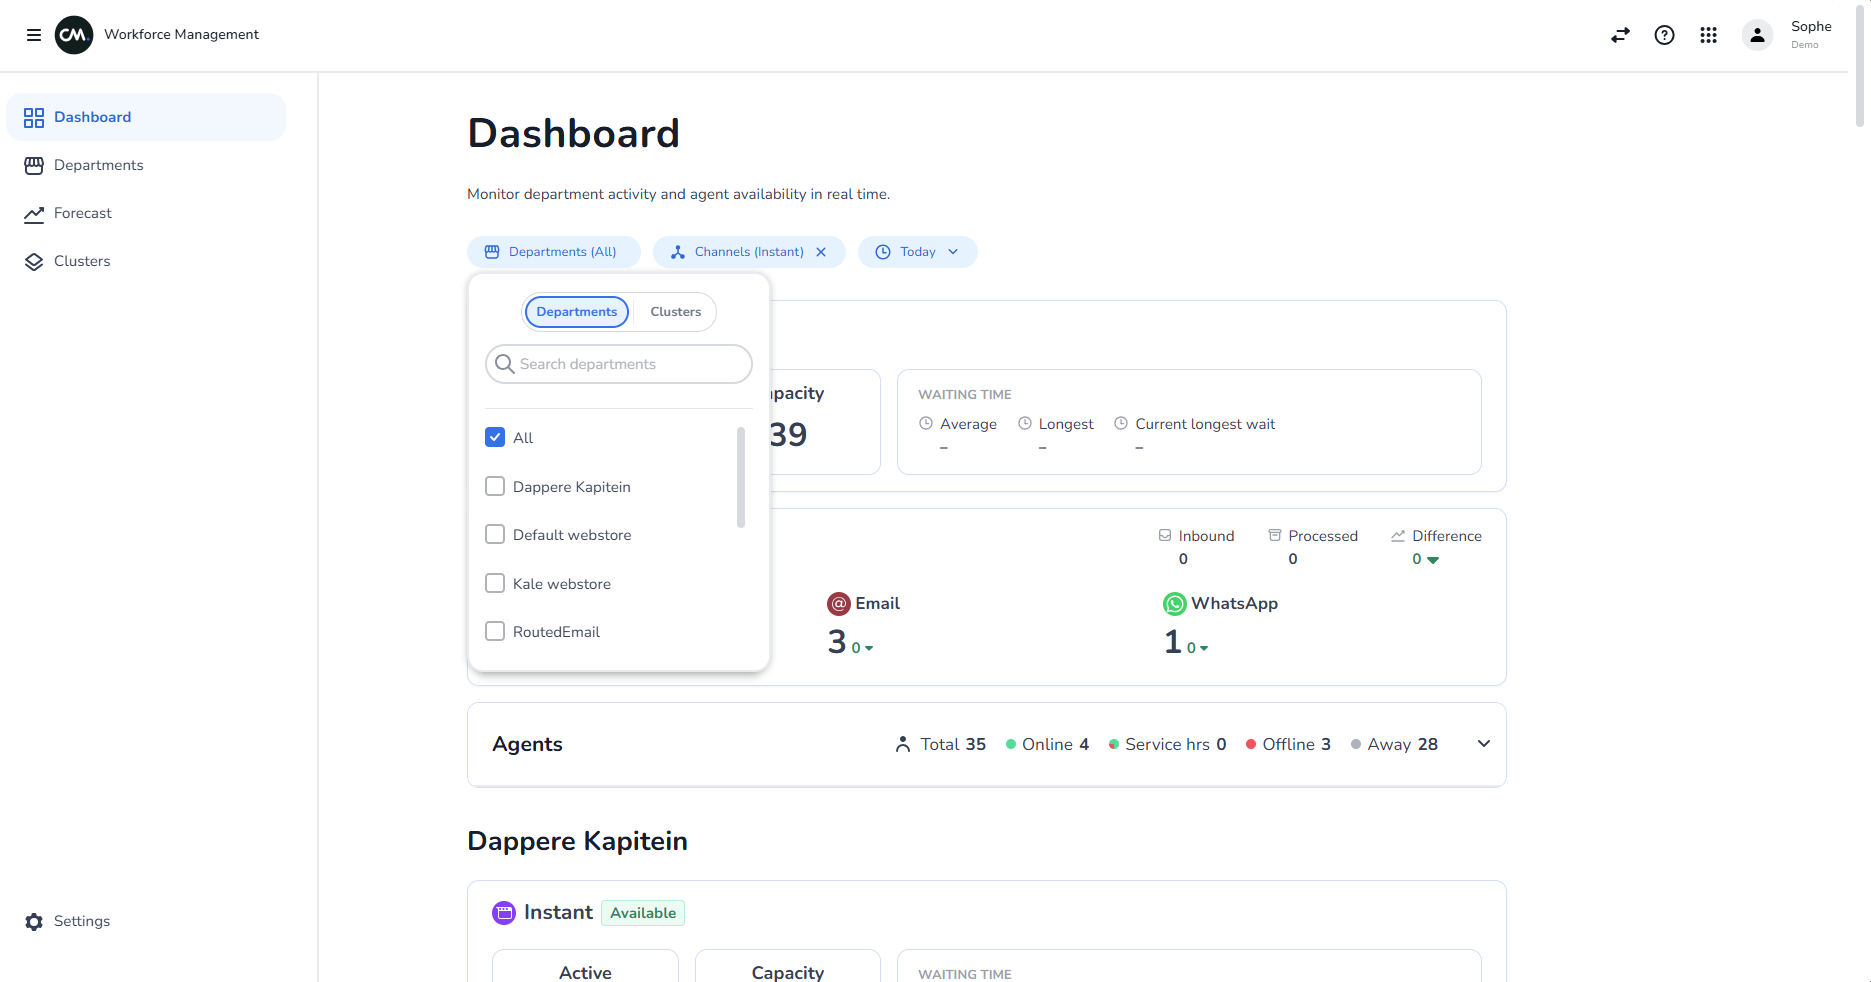
Select the Departments filter. The list that opens has two views, which you switch with the toggle at the top.
Departments view
- Select the Departments filter.
- Make sure Departments is selected in the toggle at the top.
- Type in Search departments to find a department by name.
- Tick the departments you want. You can tick as many as you like.
The filter shows Departments (All) when nothing is ticked, and Departments (3), for example, when three are ticked. Select All or the clear icon on the filter to go back to showing every department.
Clusters view
- Select the Departments filter.
- Select Clusters in the toggle at the top.
- Use the search box above the list if you need to find a cluster by name.
- Select one cluster.
You can only pick one cluster at a time. The Dashboard then shows the departments that belong to that cluster. The filter shows Clusters (All) until you pick one, and then Clusters (name of the cluster). Select All or the clear icon to clear the cluster.
Your department choices and your cluster choice are kept separately. Switching between the two views does not erase either of them, and only the view you are on affects the Dashboard.
Don't have any clusters yet? See Clusters.
[IMAGE NEEDED: #1 — The same filter open on the Clusters view, with one cluster selected and the pill showing the cluster name.]
Channels
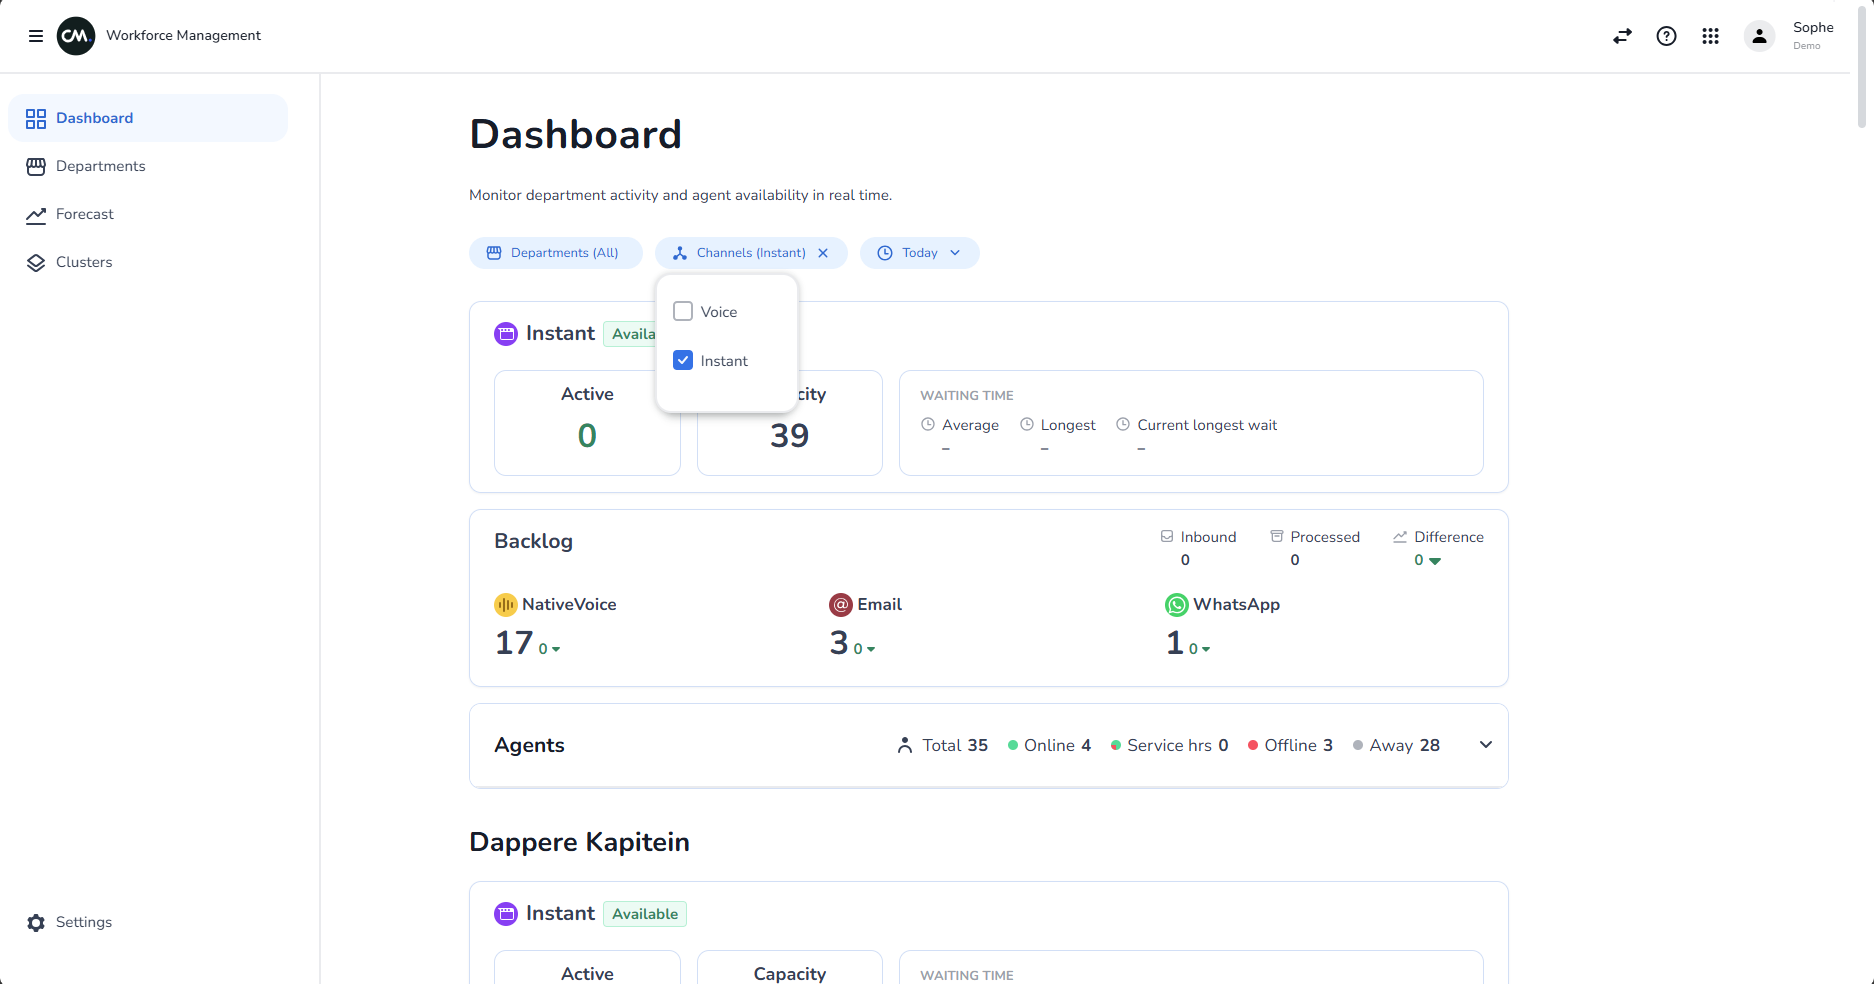
Use the Channels filter to choose between Voice and Instant.
- Channels (All) shows both.
- Choose just one to hide the other card.
- At least one must stay selected.
This filter only affects the Voice and Instant cards. Backlog and Agents are always shown.
Choose the time range
The time range filter decides which period the results cover. It shows Today until you change it.
- Select the time range filter.
- Pick one of the options on the left:
- Today — From midnight until now
- Last 1 hour
- Last 3 hours
- Last 6 hours
- Last 12 hours
- Or choose your own start under From. Pick a date and time that is not in the future. The results then run from that moment until now.
- Change the Time zone if midnight and the start time should follow a different zone. By default, it is the time zone of your browser.
The Now field only shows the current time in the chosen zone. You cannot change it.
When you pick a preset, the filter closes straight away and the page updates. A custom start time works the same way. If you pick a custom start, hover over the filter to see the exact start date and time.
The time range goes back to Today each time you open the page. The time range affects the results that cover a period of time, for example how long calls waited or how many calls were missed. It does not change counts of what is happening right now, such as calls in the queue.
[IMAGE NEEDED: #2 — The time range filter open, showing the presets on the left (Today, Last 1 hour, Last 3 hours, Last 6 hours, Last 12 hours) and the From, Now and Time zone fields on the right.]
Voice card
The Voice card shows phone calls. A tag in the card header says Available or At capacity. It shows At capacity when at least one call is waiting in the queue, and Available when none are.
| Label | What it means |
|---|---|
| Queue | Calls that are waiting and have not yet been connected to an agent |
| Ongoing | Calls in progress with an agent |
| Wrapup | Calls that have ended while the agent is still finishing work related to the call |
| Capacity | The number of agents who are currently active on voice |
Waiting time shows how long callers waited:
| Label | What it means |
|---|---|
| Average | The average wait of calls that were connected to an agent during the time range |
| Longest | The longest wait among those calls |
| Current longest | How long the call that has waited longest in the queue has been waiting right now |
Wait times are colored green when they are under one minute and red when they are longer. A dash (–) means there is nothing to show yet, for example when no calls were connected during the time range.
Below that, you find six more figures:
| Label | What it means |
|---|---|
| Picked up | Calls that were answered |
| Missed | Calls that were not answered |
| Callbacks received | Callback requests that came in |
| Callbacks handled | Callback requests that were handled |
| Avg wrap-up time | The average time agents spent in wrap-up |
| Avg call time | The average length of a call |
Instant card
The Instant card covers conversations in instant channels such as chat.
| Label | What it means |
|---|---|
| Active | Open instant conversations that have not been replied to yet |
| Capacity | How many instant conversations your available agents can take at the same time |
The header tag shows At capacity when Active has reached Capacity, and Available otherwise.
The Waiting time box works as on the Voice card, with Average, Longest and Current longest wait. Current longest wait only counts conversations that are waiting for a first answer. Snoozed conversations are not included.
Backlog card
The Backlog card shows how much work is open and how it moves during the time range.
At the top right you find three figures:
| Label | What it means |
|---|---|
| Inbound | Conversations that started during the time range |
| Processed | Conversations that were completed during the time range. For voice, calls that were missed are not counted as processed. |
| Difference | Inbound minus Processed. An up arrow means more came in than were processed. A down arrow means the opposite. |
Below that, there is one box for each channel with traffic. It shows:
- The channel name
- The number of open conversations in that channel right now. This number does not depend on the time range.
- An arrow and number showing how many more conversations came in than were processed (up arrow), or the other way around (down arrow), in the time range
Agents
The Agents panel lists the agents of a department. It starts closed so the page stays short. Select the header to open or close it.
The header always shows these counts, even when closed:
| Label | What it counts |
|---|---|
| Total | All agents in the list |
| Online | Agents who are online, including agents who are busy |
| Service hrs | Agents set to Service hours (automatic) |
| Offline | Agents who are offline |
| Away | Agents who are away |
When the panel is open, you see a table with these columns:
| Column | What it shows |
|---|---|
| Name | The agent's name |
| Status | An icon showing whether the agent is online, busy, away, offline or on service hours, and the state of their voice. Hover to read it in words. |
| Time in status | How long the agent has been in the current status. Hover to see since when. |
| Voice time | The length of the current call (green), or of the current wrap-up (orange). Empty when the agent is not on a call. |
| Capacity | Open instant conversations out of the most the agent can take, for example 2/5. It is green while there is room and orange when the agent is full. |
| Processed | The number of conversations the agent completed in the time range, for each channel |
| Departments | +2, for example, means the agent also works in two other departments. Hover to see which ones. A dash means the agent works in no other department. |
The Status tooltip can read:
- Online
- Service hours (automatic)
- Offline
- Away
- Busy (max waiting)
- Busy (max instant)
- Busy (on phone)
It can be followed by Voice: Active, Voice: Hindered or Voice: Inactive. If the agent has set a status reason, the reason is shown first.
[IMAGE NEEDED: #3 — The Agents panel open, showing the header counts (Total, Online, Service hrs, Offline, Away), the table columns and the pagination at the bottom.]
[IMAGE NEEDED: #4 — The tooltip that appears when hovering over an agent's Status icon.]
Sort and page through agents
- Without sorting, agents are ordered by status: online first, then busy, offline and away.
- Select the sort arrow next to Name, Status or Processed to sort. Select it again to reverse the order, and a third time to go back to the default order. Only one column is sorted at a time.
- Use the page controls at the bottom to move between pages. The default is 10 agents per page. For each department, the page and page size you chose are remembered in your browser.
In the overview
The overview at the top of the page combines all the departments you selected:
- Counts such as Queue, Ongoing and Active are added up.
- Longest and Current longest show the highest value among the departments.
- Average is the average of the departments' averages.
- Agents who work in more than one selected department appear once. Their processed conversations are added up.
Tips
- To follow one team, tick just that department. To follow a group of teams, create a cluster and select it.
- Use Last 1 hour when you want a recent picture. Use Today for a full-day view.