Dashboard and analytics
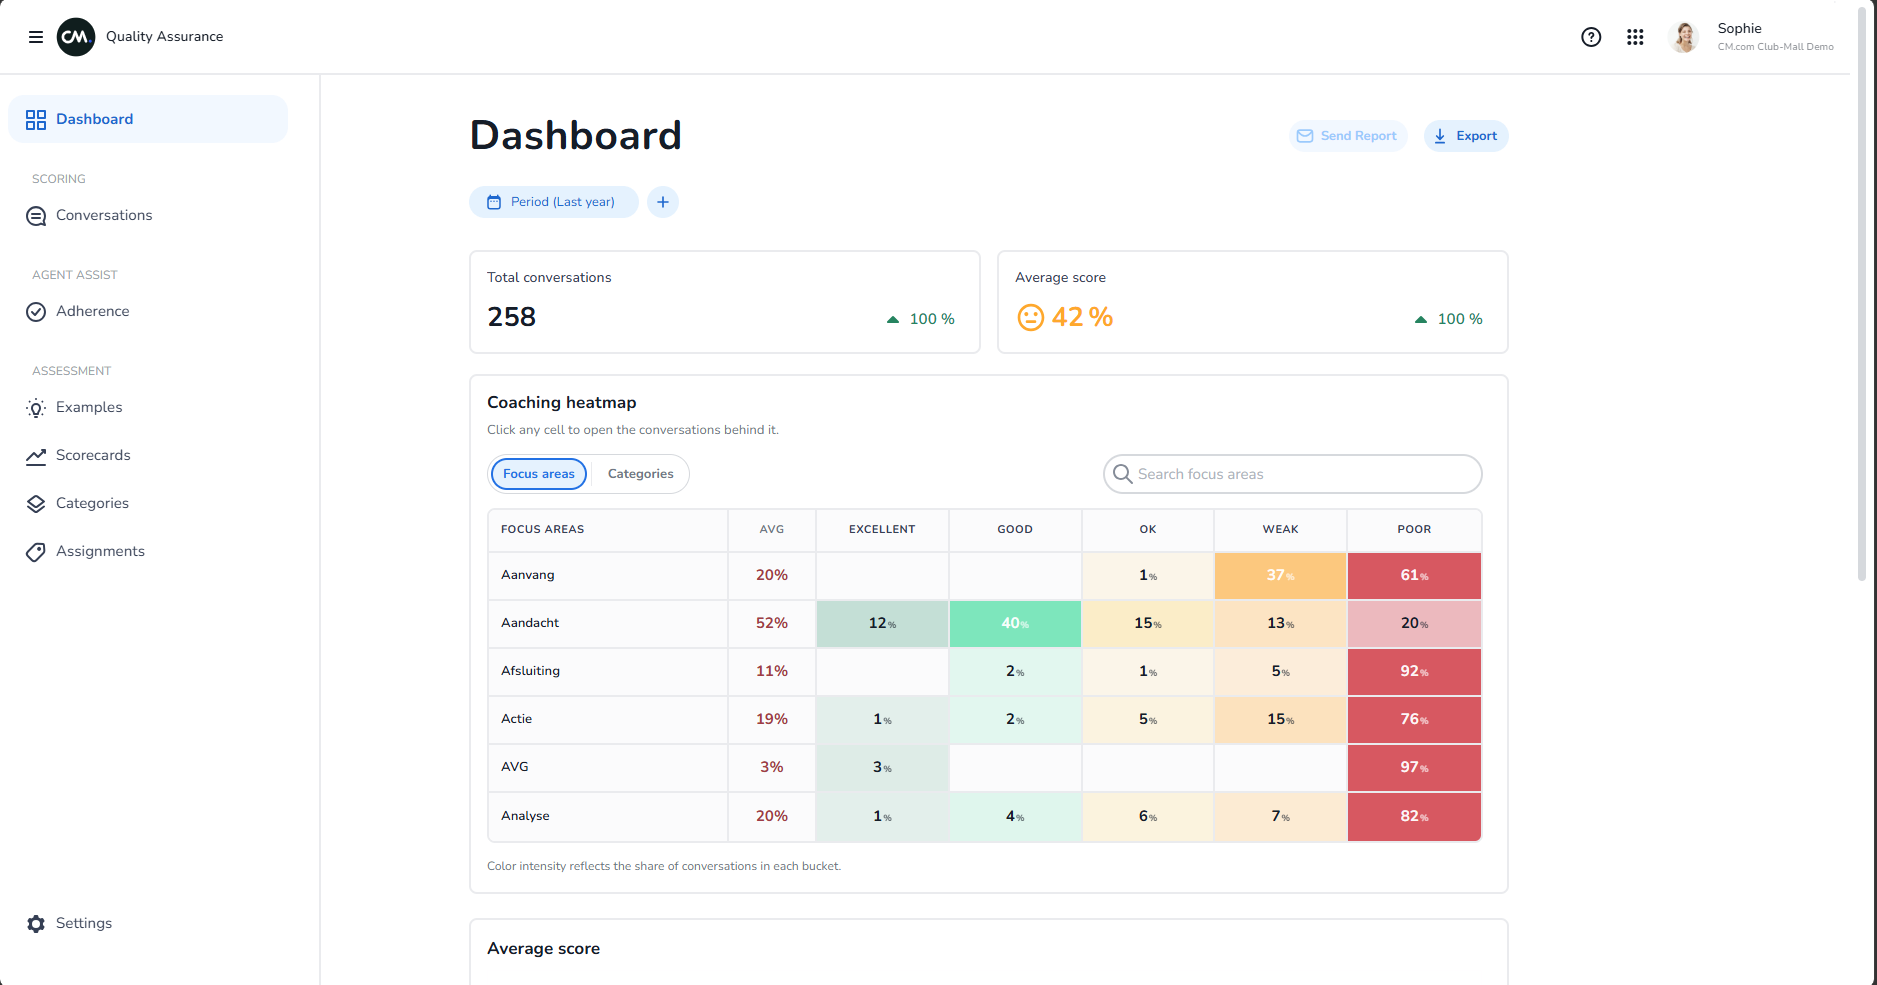
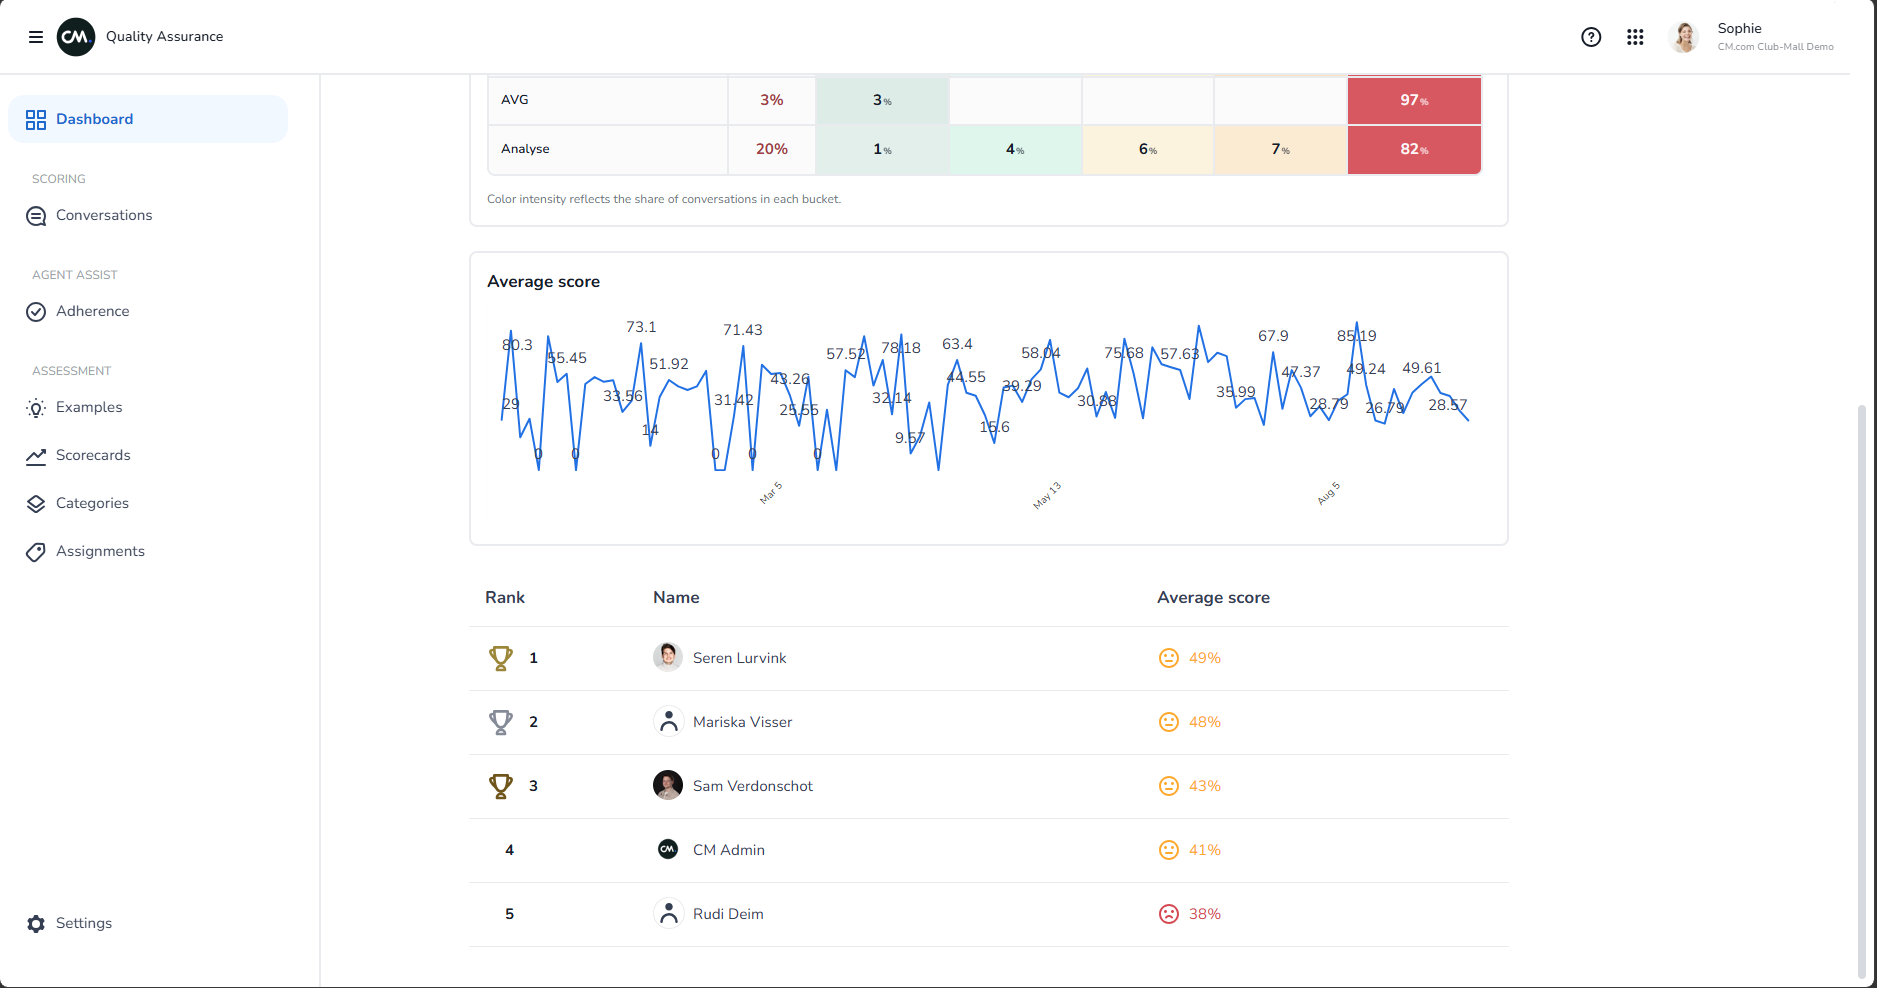
Your dashboard shows how your team is doing — overall quality scores, which agents are top performers, and where to focus coaching.
See your stats
- Go to Dashboard in the left menu
- (Optional) Filter by date, channel, team, or department
You'll see:
- Total conversations reviewed — how many you've reviewed
- Average quality score — what percentage your team is scoring
- Score trend — is quality going up or down over time?
See what areas need coaching
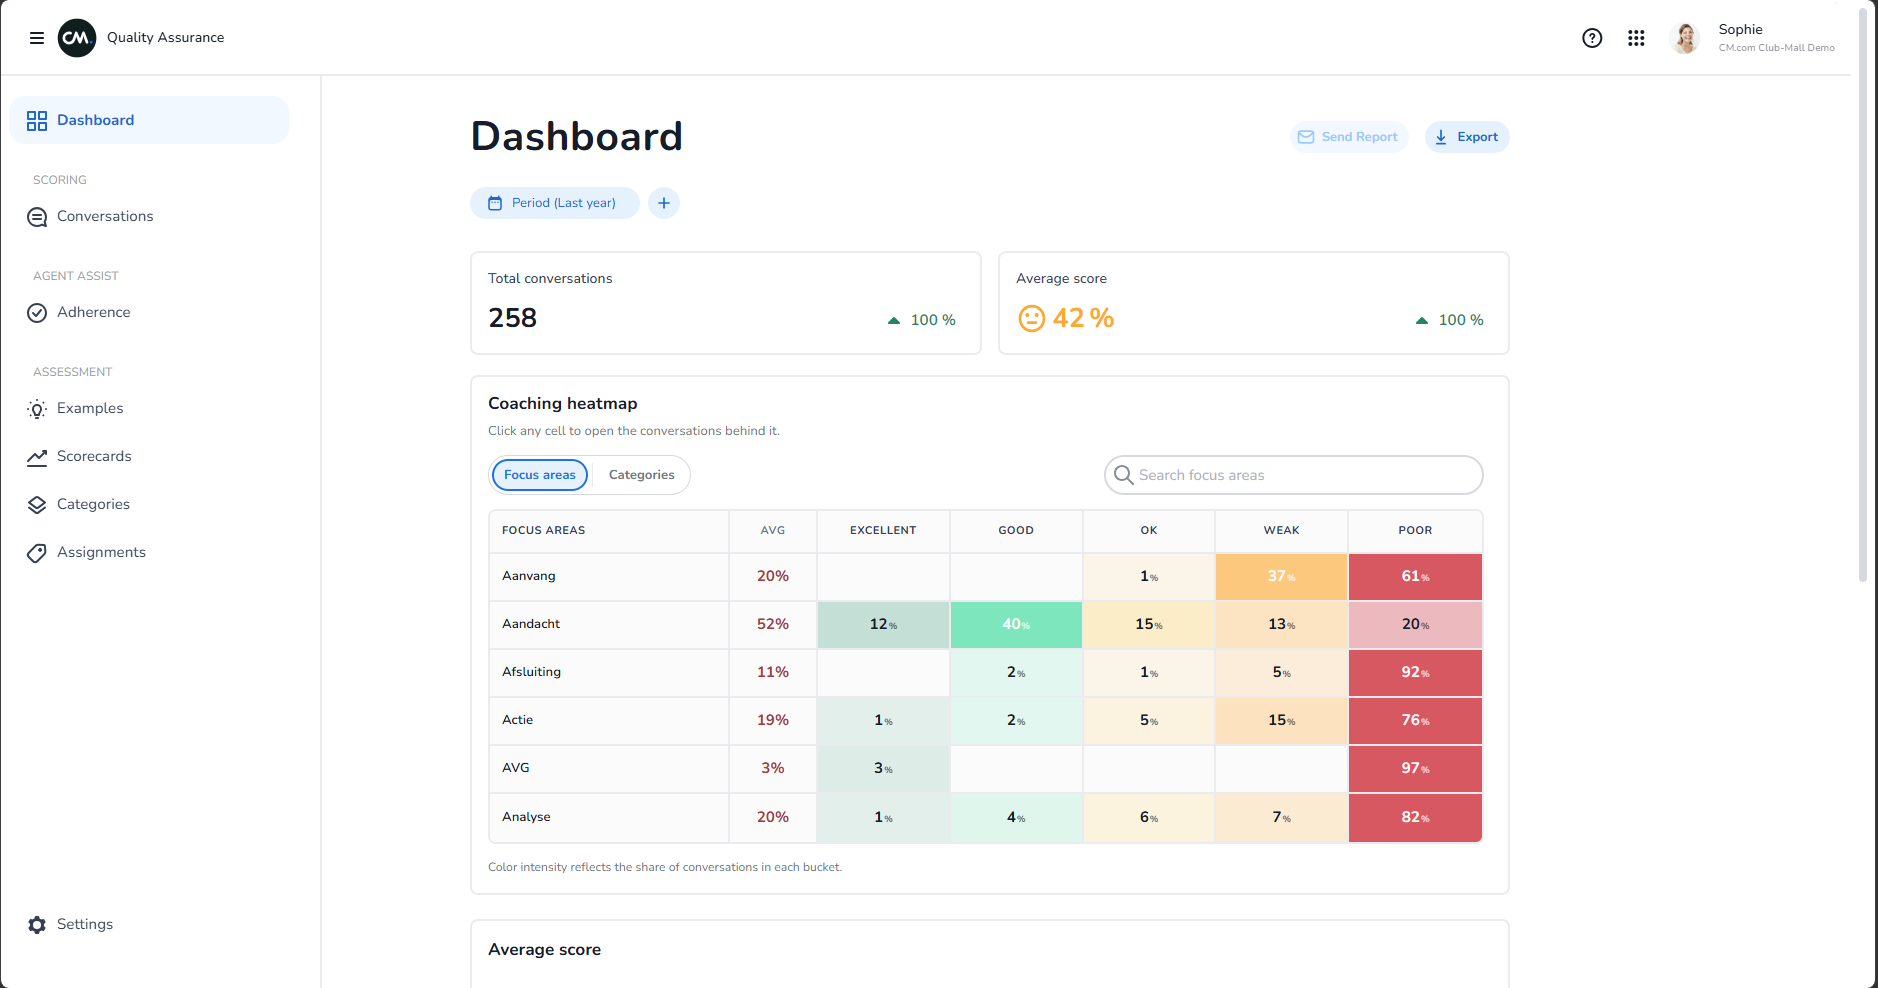
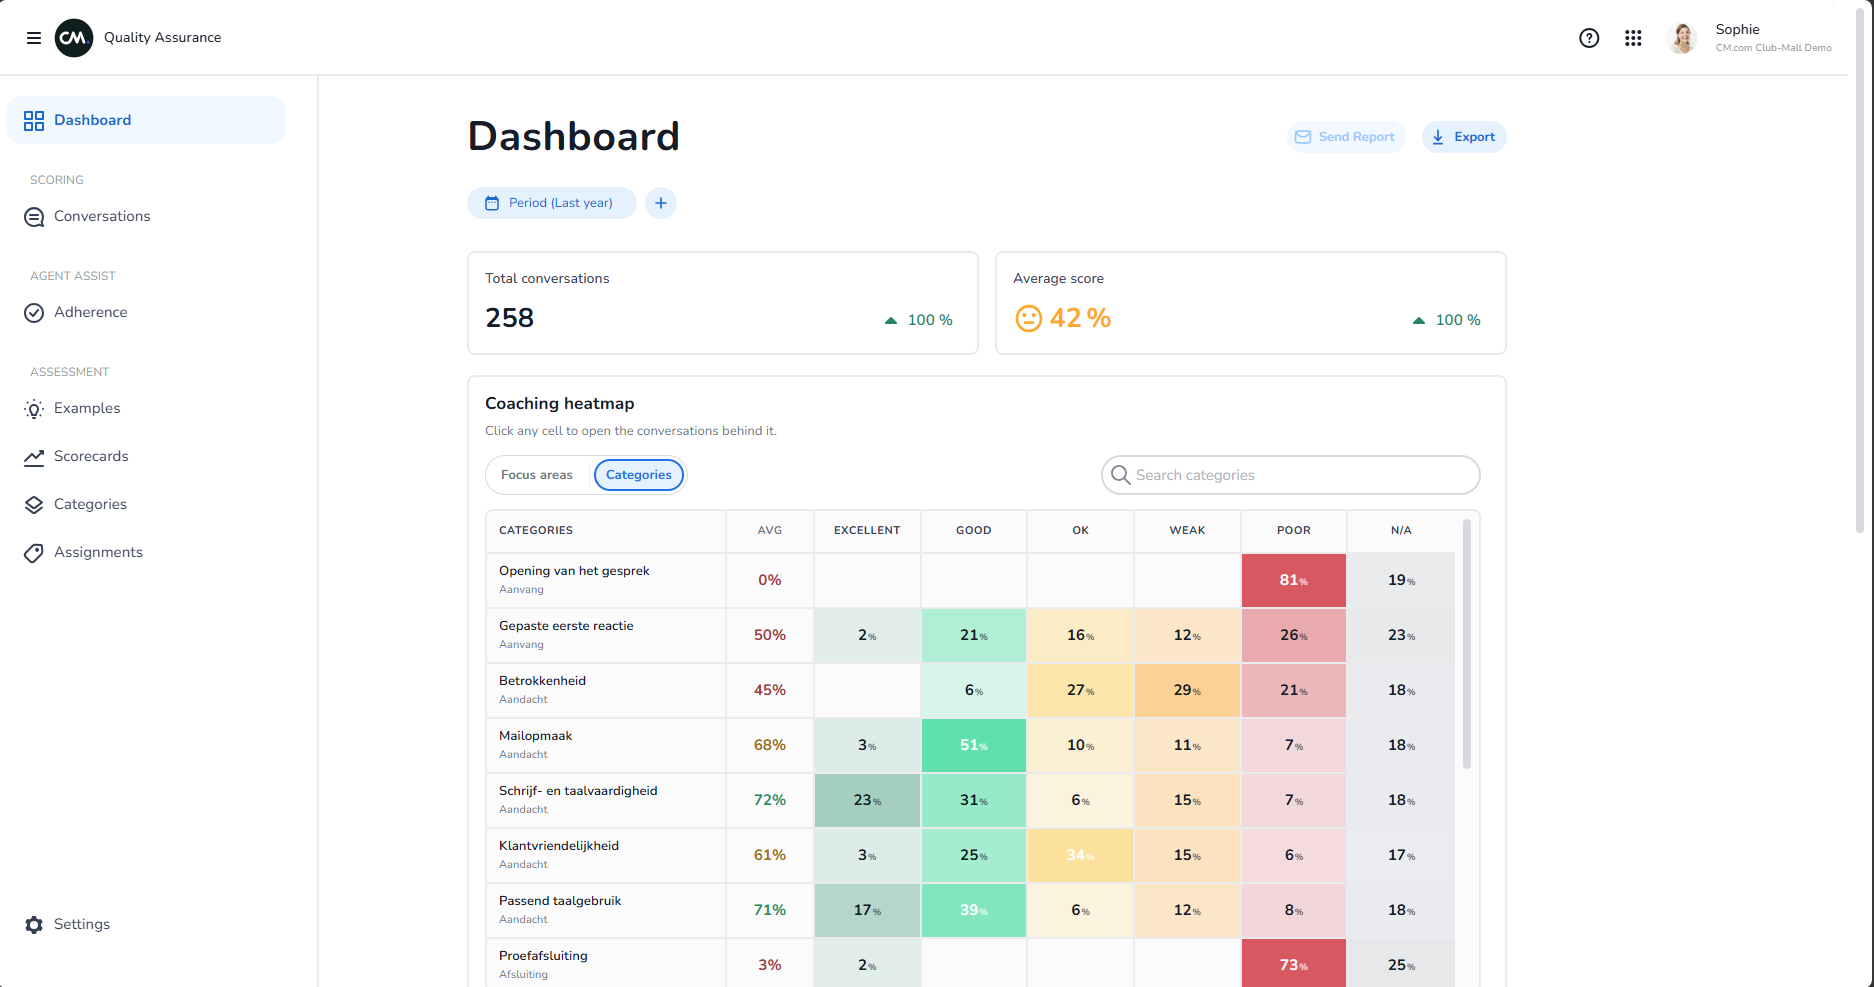
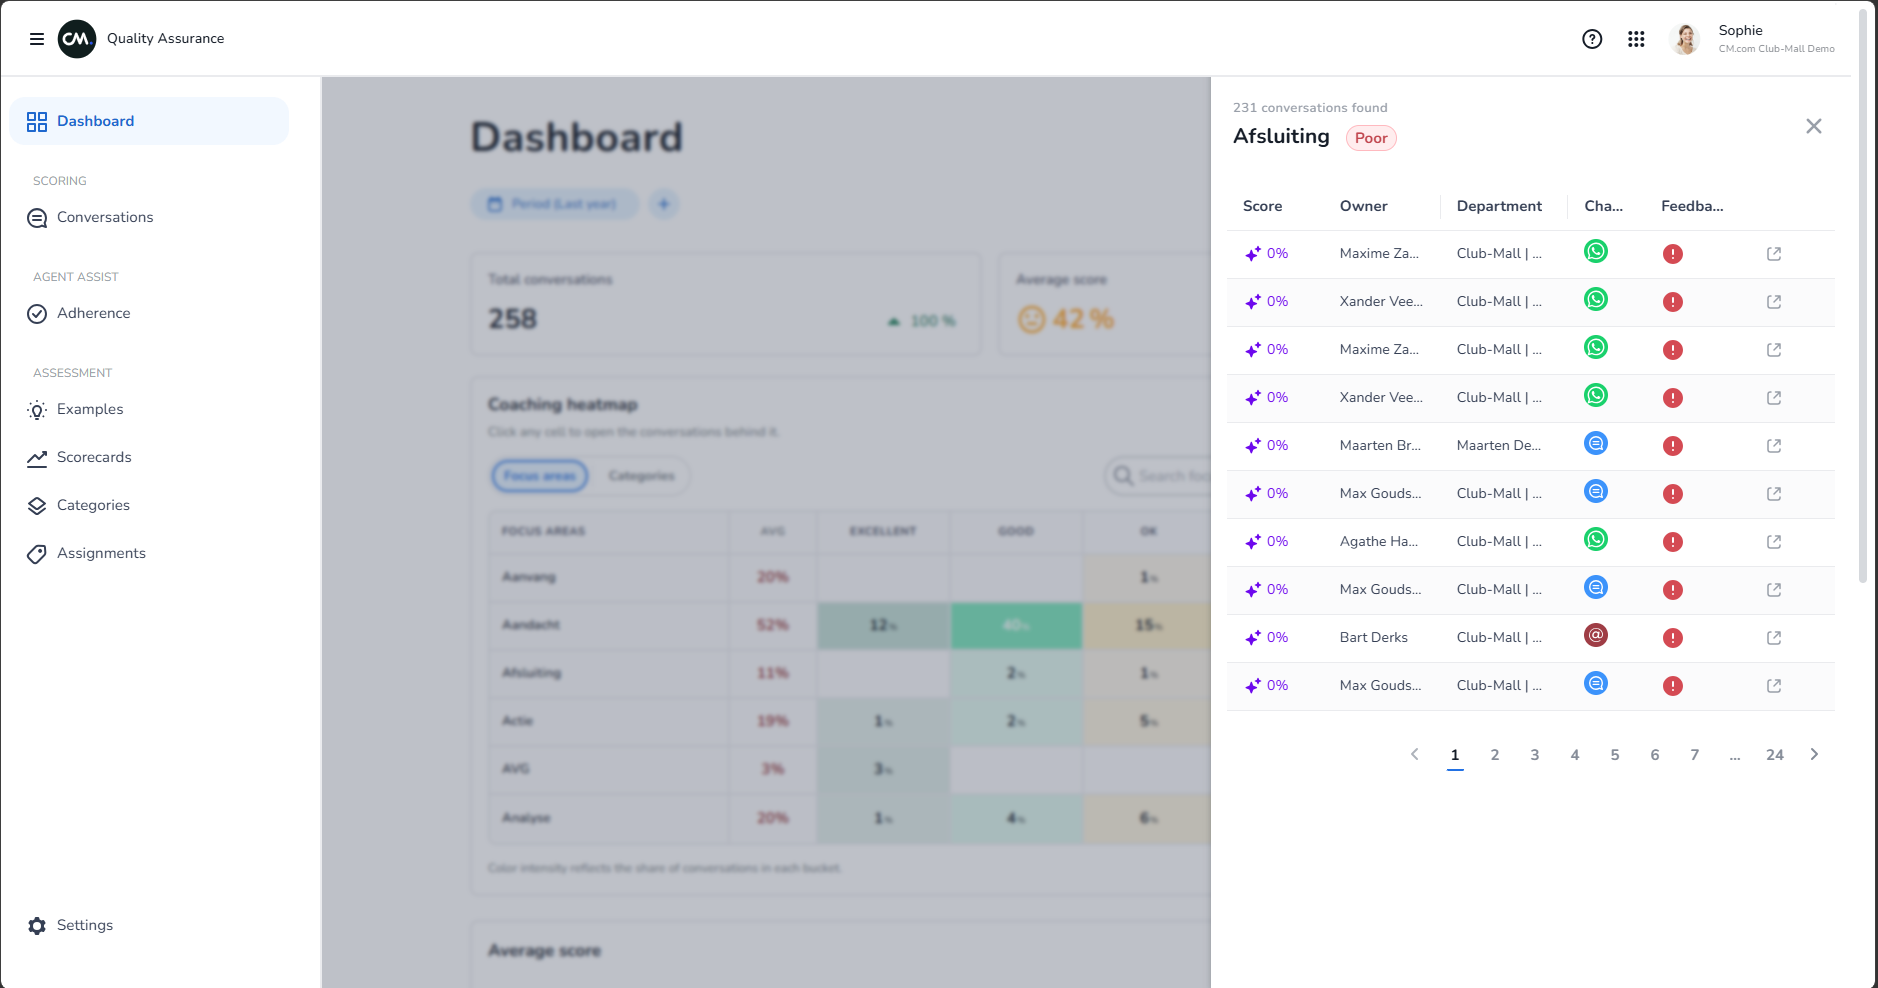
The coaching heatmap shows:
- Each agent (left side)
- Each quality category (top)
- Where each agent struggles (dark areas = low scores)
Click any cell to see that agent's specific conversations in that category.
Example: If the "Politeness" column is dark for Agent A, you know that's where to coach them.
See top agents
Top agents shows your best performers — with medals for 1st, 2nd, and 3rd place.
Use this to:
- Recognize top performers
- Have them mentor lower-scoring agents
- Understand what they're doing right
Download or email a report
- Download PDF — save the dashboard as a PDF to share or print
- Email report — send to your manager or coaching team
For automatic weekly or monthly reports sent to your inbox, see Settings → Report scheduling.